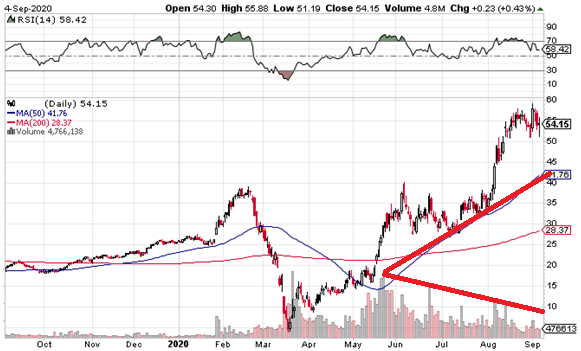
Let’s do a stock chart Rorschach Test, putting current events out of your mind. If that’s even possible. I’ll show you a 52-week chart of a gaming stock and you tell me what happened.
Looks like speculation reached a peak in February, followed by major disappointment in March that almost bankrupted the company as it traded close to zero. Maybe, like 888 9 years ago, they were kicked out of some promising jurisdiction or other by regulators. But then, maybe management regrouped and pulled it all together, cleaned up their business plan and finances somehow, became leaner and more efficient, grew the clientele and gaming activities and really exploded by the summer.
Yeah, except the kind of process just described takes years to unfold, not months. Compressed all into one year, it looks a lot more like something almost died here and then took a major stimulant and went crazy. And that is what actually happened. Above is a 52-week chart of Penn National Gaming, whose business has been all but destroyed by COVID-19 restrictions. In the initial run to old highs in June, volume climaxed. As the stock has run up to new all time highs since, trading volume has continually dropped off in the opposite direction. See the red lines, both literally and figuratively.
This means much fewer people bought shares at these record higher levels than did at lower levels. When the few who bought at the top start selling, nobody from previous rounds is going to fill their orders. Remember, all you need theoretically speaking for a stock to careen higher out of control are precisely two people buying and selling a single share back and forth between them at higher and higher handles.
